Setting levels
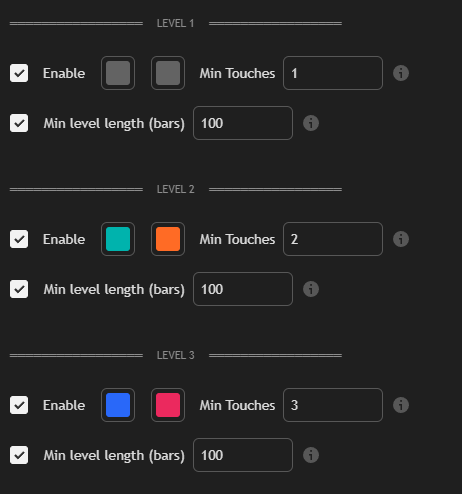
After long testing it was found that if a level has at least 3 touches, it doesn’t matter whether it has 3, 4, or 10 — they behave the same. So i implemented the ability to configure and search for three level types with different settings.
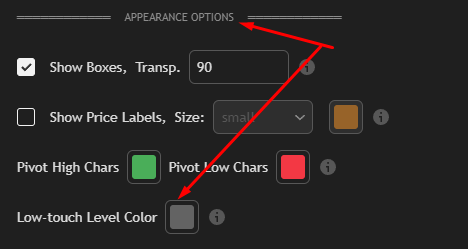
For each level setting you can set separate colors for support and resistance, the minimum number of touches, and min level length in bars. You can also quickly disable searching/display for that level.

If touches are clear, the only confusing option might be "Min level length (bars)".
Use the ruler and check how many bars the level spans:
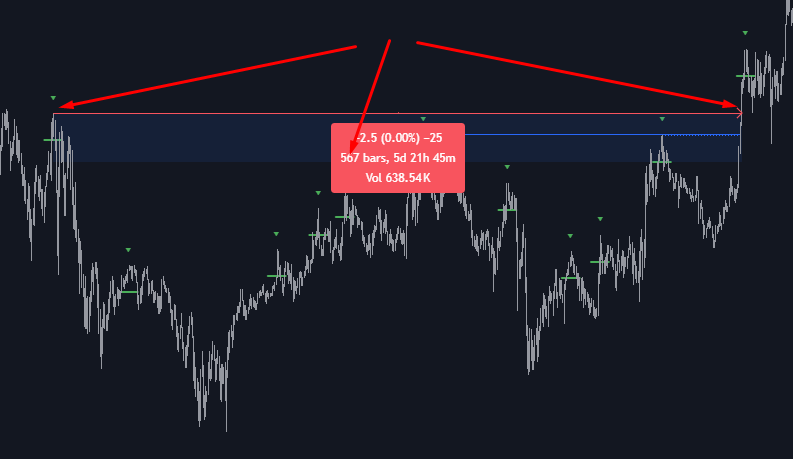
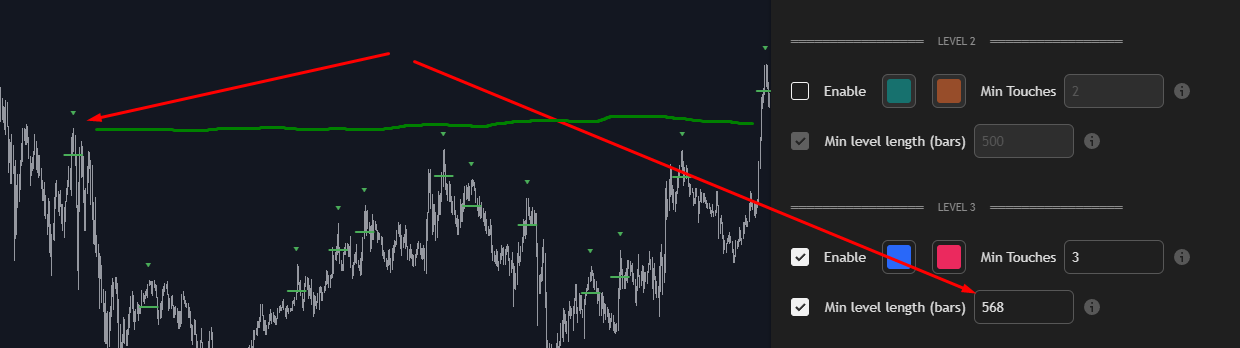
This level is 567 bars long. If the setting requires at least 100 bars length, the level is found and displayed. But if you set the minimum to 568 bars, it will not be shown:
This setting helps remove noise, especially when using single-touch levels. Example:
Here the min length is 20 bars; set it to 100 and extra noise disappears:

Smart support & resistance levels
No matter the order in which you configure level search, the indicator will automatically redraw levels depending on the number of touches.
Example settings:
First the indicator will find a level configured for 1 touch:
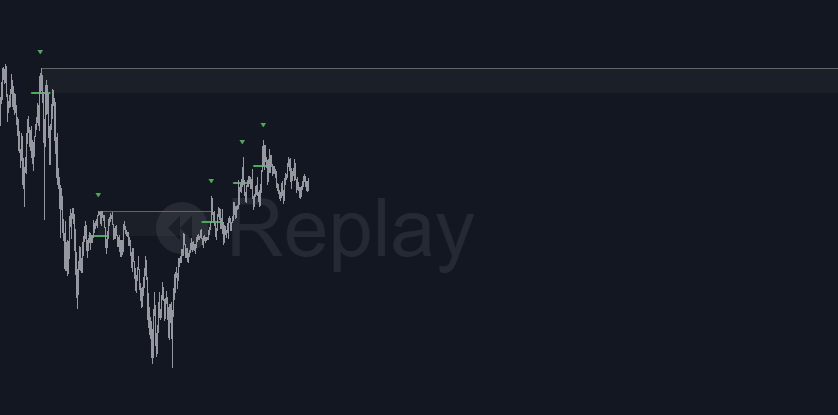
When a second touch appears, the indicator will redraw the level using the settings for 2 touches:
When a third touch appears and it satisfies the 3-touch settings, it will be redrawn accordingly:

This is a great algorithm:

It prevents the situation where a 1-touch level is drawn first and then blocks detection of other configured levels. It also works in reverse — if touches decrease, the color changes to reflect the level settings that match the new touch count and length. So you may see a level that was blue for 3 touches later become colored as a 2-touch level; previous blue lines remain as historical markers showing that originally there were 3 touches:

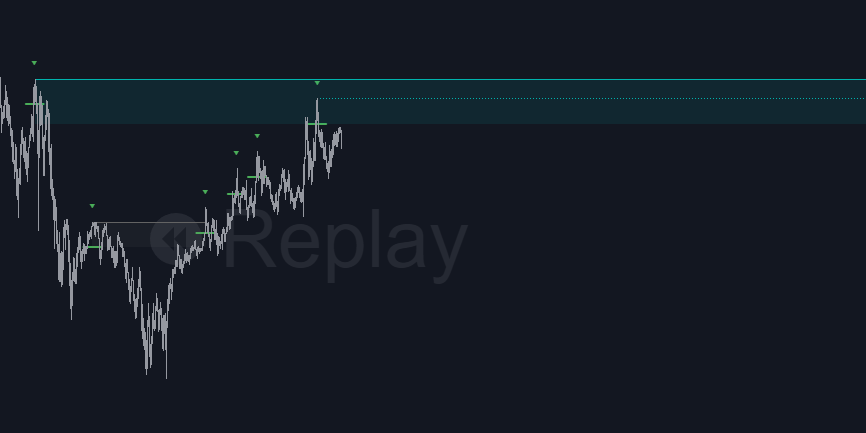
The Box follows touches to create cascades of levels
Example:

The Box corresponds to the value in "Max deviation between pivots (%)".
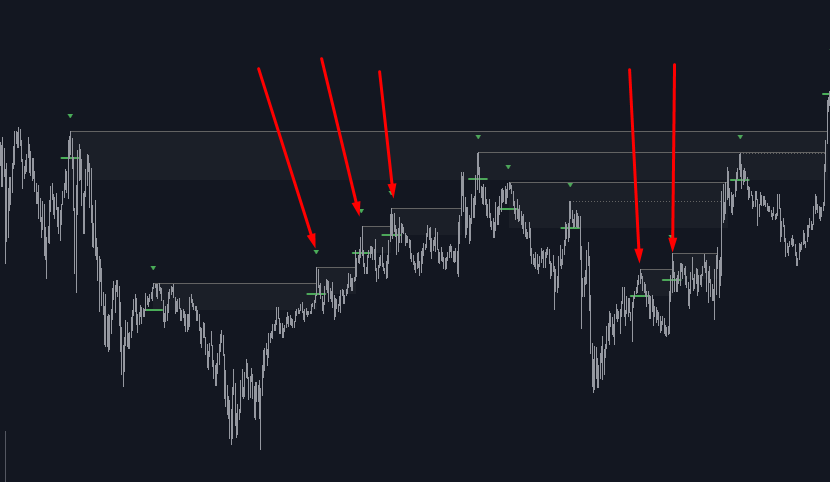
Initially the Box width is small, but when a new pivot appears inside the Box it expands to the "Max deviation between pivots (%)" of the new pivot:

Thus the Box gradually grows, collecting pivots and creating cascaded multi-touch levels that price breaks cleanly:

Why the last line in a level is always shown as dots
From extensive testing across instruments, the last pivot in a cascade is usually the least reliable — it often produces false breakouts. Treat it with extra caution. Therefore the last line in a cascade is always displayed as dotted.
What happens if the number of touches falls below the level setting
The level color changes to the color you set for that touch-count scenario: